WORKS
A 3D simulator of Mt. Fuji lava flow has been developed and demonstrated
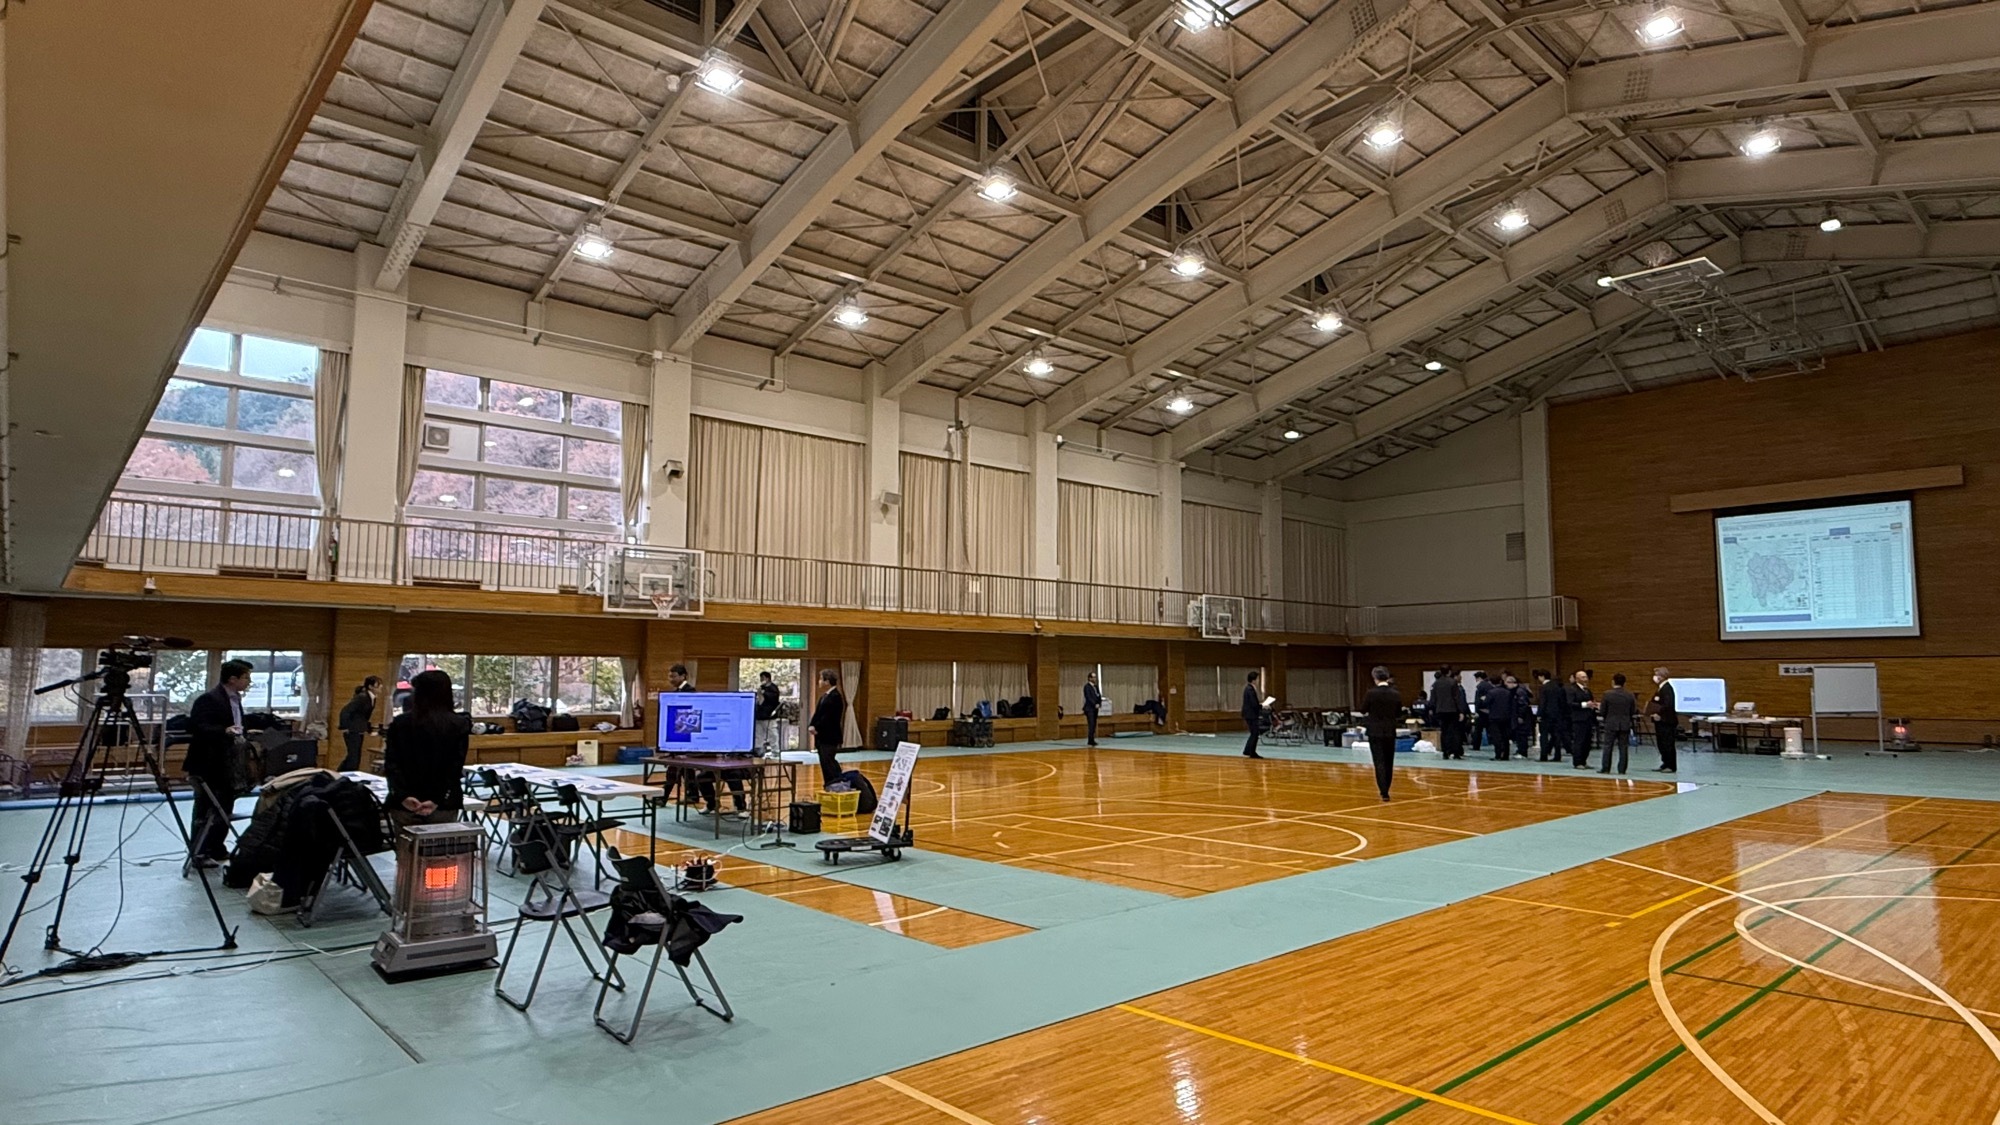
Kadinche Co., Ltd. participated in the “Reiwa 7 Mt. Fuji Volcano Disaster Prevention Measures Disaster Prevention Practical Training” held on the shore of Lake Kawaguchi in Yamanashi Prefecture on 2025/12/3 (Wednesday), and demonstrated lava flow simulations that were selected for the “Yamanashi Volcano Disaster Prevention Innovation Pitch Contest 2025” and have been developing together with the Fujisan Institute of Science.
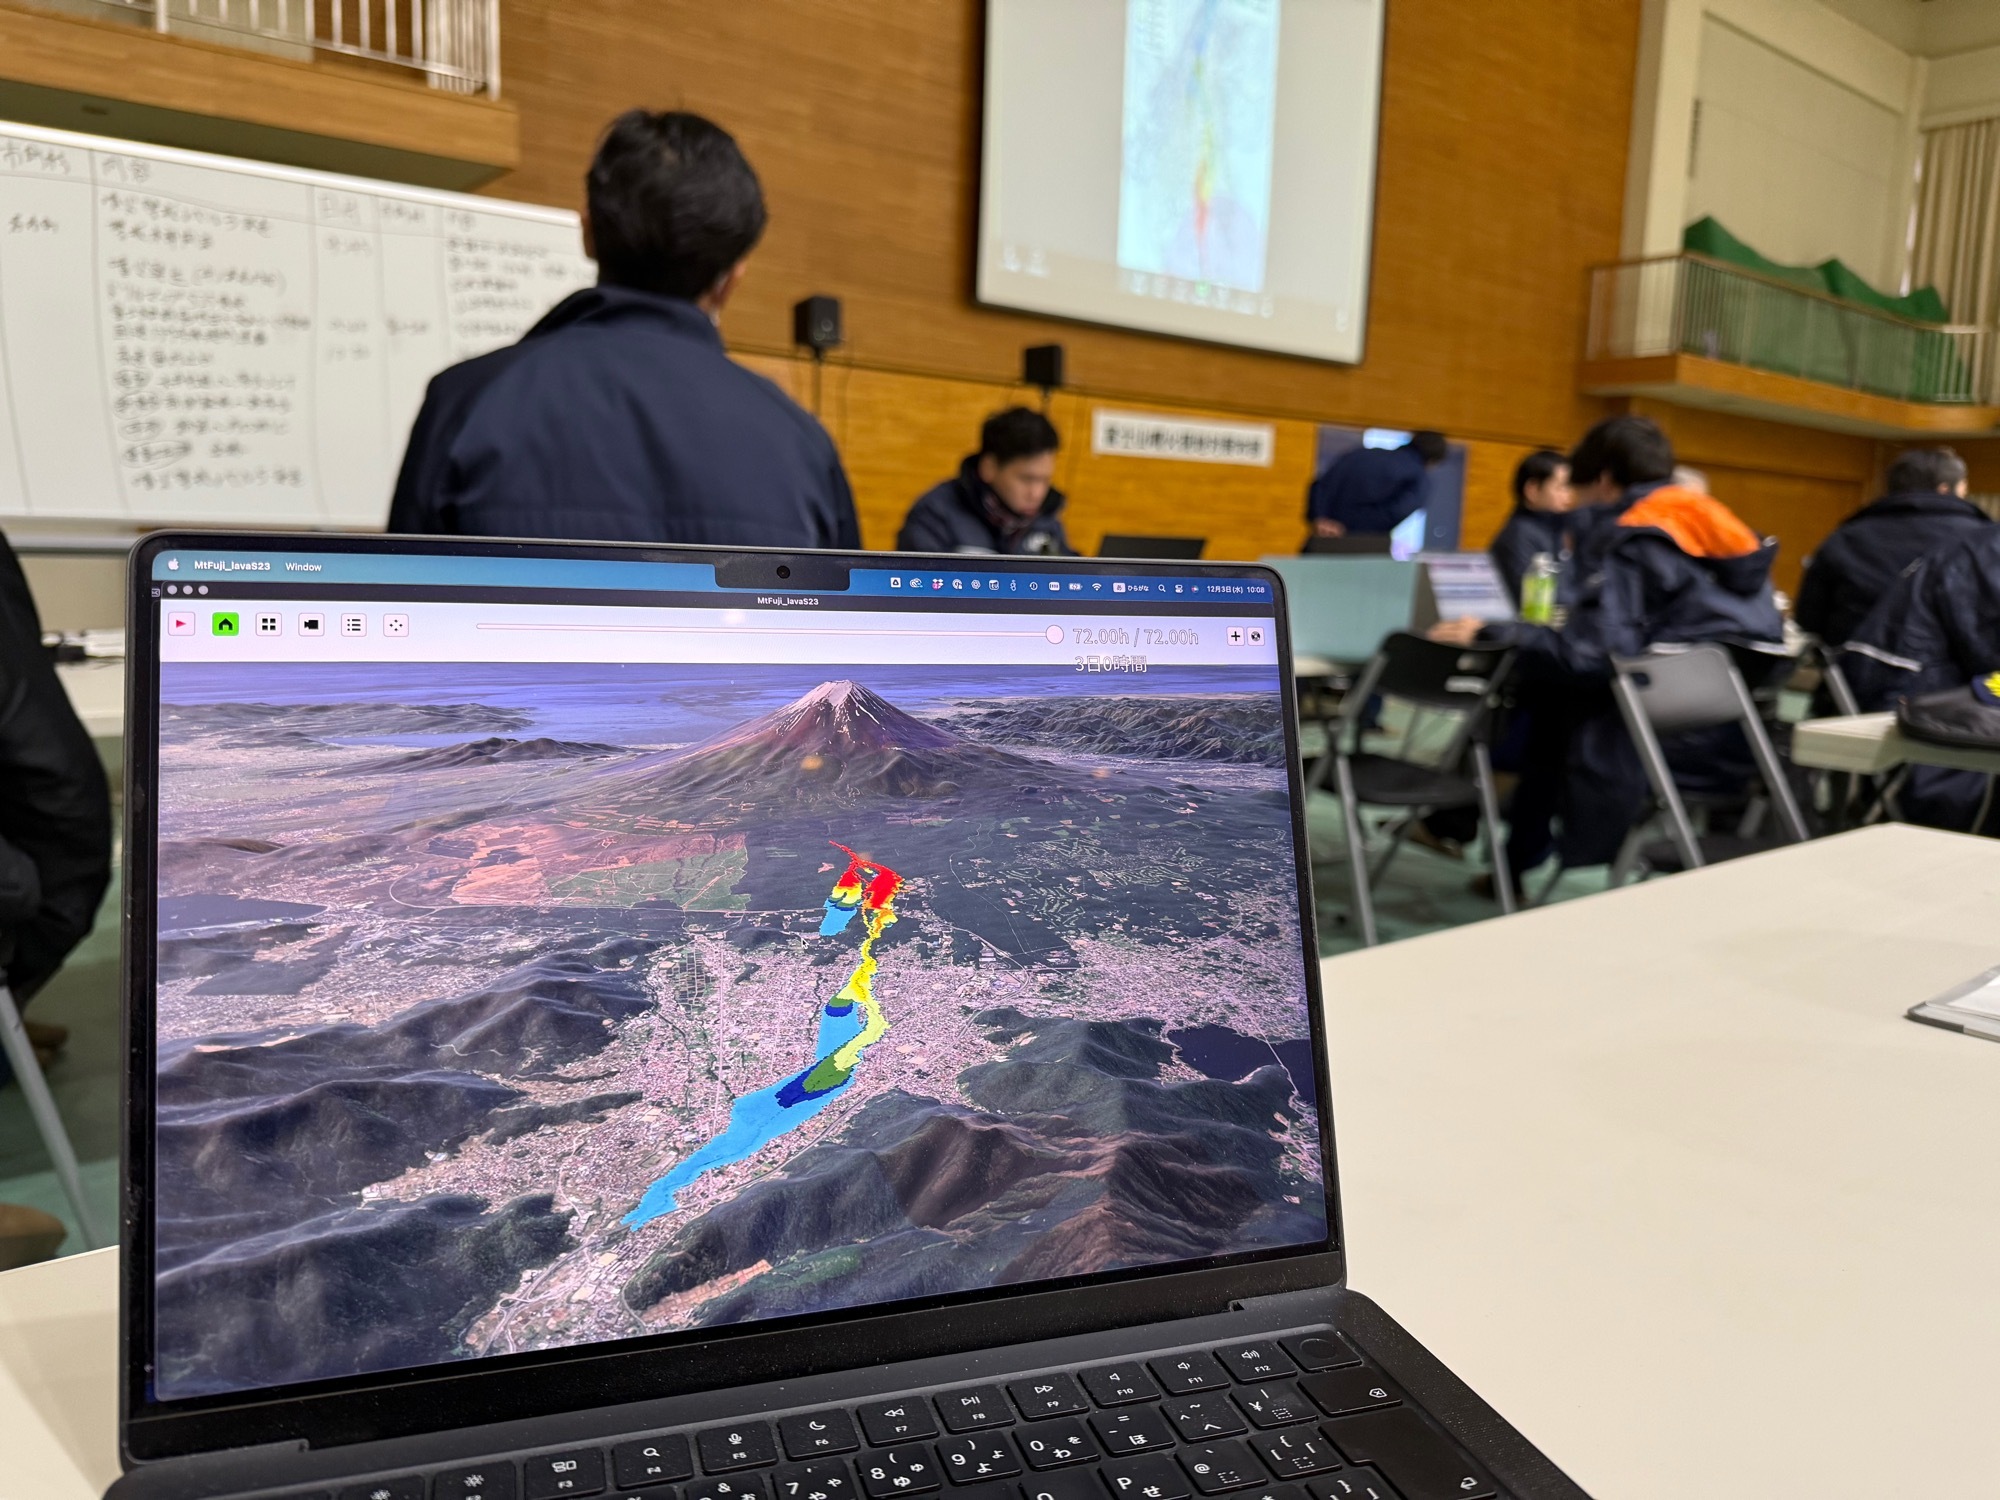
This 3D simulator is an application that can confirm lava flow arrival points over time from a free perspective by visualizing lava flow simulation data on three-dimensional topographic data or satellite images.
This simulation is implemented as an application that can be executed on Windows and Mac. You can view 3D topographic data and satellite images of the city of Mt. Fuji and the surrounding area from a free 3D perspective. A keyboard or mouse is used to move the viewpoint, and it is now possible to move up, down, left, right, back and forth. The difference from conventional paper hazard maps is that the location can be moved freely, and it is also possible to enlarge, reduce, and take a bird's-eye view, etc.

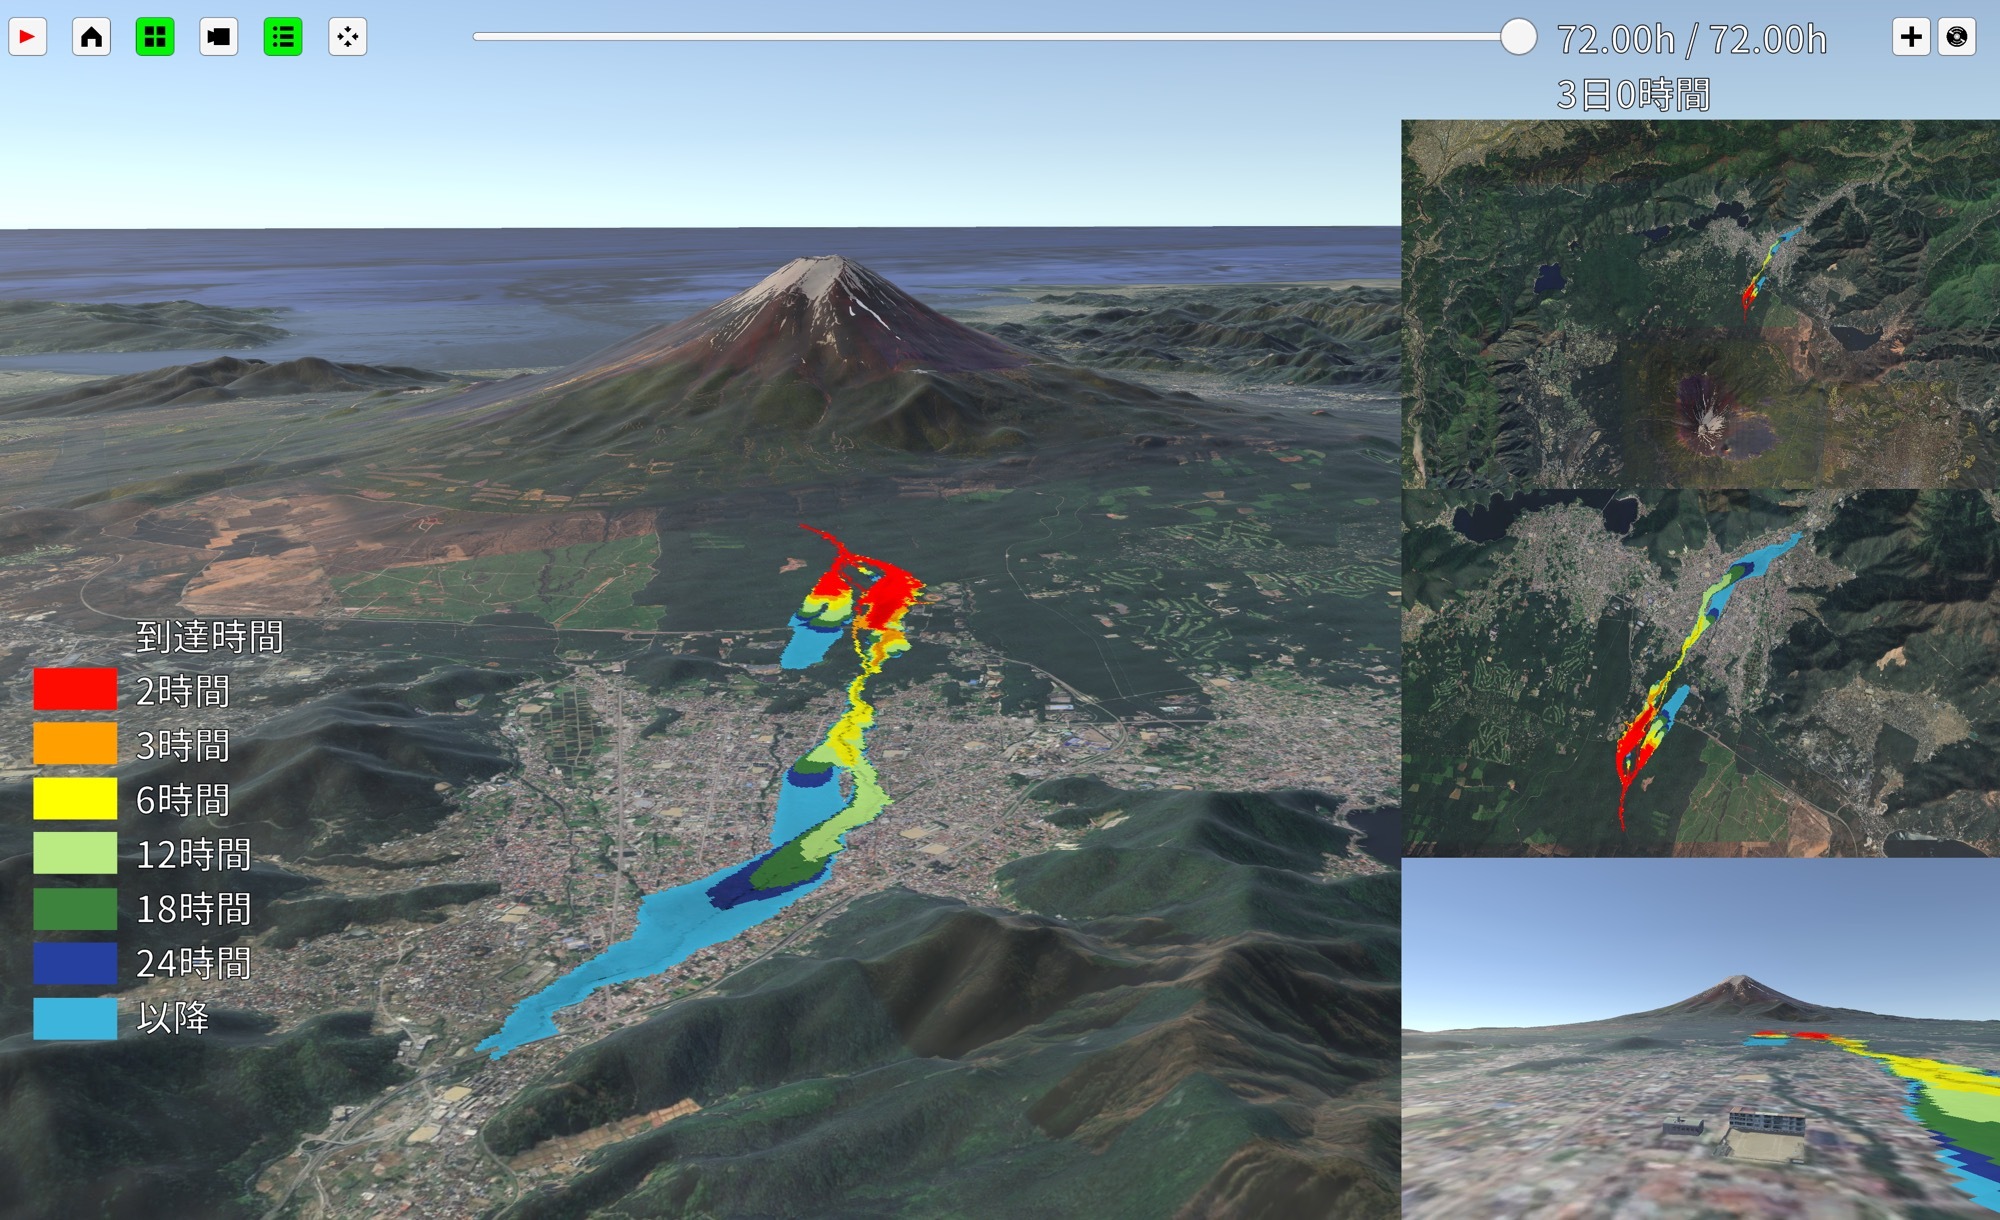
The lava flow simulation data itself was provided to the Fujisan Scientific Research Institute, and it is flowed in chronological order, and the color changes according to the passage of time. As for the time frame travel interval, the progress of 3 full days is visualized in 15 minute increments from immediately after the eruption until 3 hours after the eruption, in 1 hour units until 24 hours later, and thereafter in 6 hour increments. By operating the slider, you can move in time to the specified time zone.
When you press the home button on the house mark, the location of the Yamanashi Prefecture Fujiyoshida Joint Government Building is highlighted. 3D models are specially arranged for the three buildings, and the left side of the screen is the Joint Government Building, next to it is Fujiyoshida Municipal Yoshida Junior High School, and the right side is Fujisan Station and train on the right. According to this lava flow pattern, it can be seen that it reaches the vicinity of the station in 6 hours from the moment the lava flow occurs.
Press the button on the right side of the home button to switch to multi-screen display/multi-view. Three screens have been added to the right side of the screen, and the upper level is displayed as seen from above with the north facing up, the lower side is Mt. Fuji and the overall image up to the joint government building is displayed, and the lower level is displayed with Mt. Fuji in view. Since 3D data is used, visualization by freely moving the viewpoint is possible.
By pressing the camera mark button, it is now possible to move to several locations, including the point that was displayed on the multi-screen display earlier.
If you press the 3-line button, an explanation about the color expression of the lava flow will be displayed. This color specification matches the color specification on the drill map, and it becomes red, orange, yellow, light green, green, blue, and light blue depending on the time.
This time, I explained specifically the craters of small-scale eruptions where the Fujiyoshida Joint Government Building is particularly affected, but it is possible to similarly visualize other craters in 3D due to large-scale eruptions, medium eruptions, and small-scale eruptions. Also, lava flows were visualized this time, but by using similar methods, it is also possible to handle pyroclastic flows and snow-melting volcanic mud flows. Going forward, I would like to develop activities aimed at improving applications and providing them to potential users according to needs.